Read time: 10-15 min | Level: Intermediate – Advanced | Updated: 2026
Introduction
Internal Quality Control (IQC) is a regular procedure conducted in a laboratory to ensure that test results are accurate, dependable, and uniform each day before sharing the results with patients.
In simple terms:
👉 IQC is similar to checking if the laboratory equipment and testing methods are functioning properly before analyzing patient samples.
Key Point: IQC specifically monitors day-to-day analytical performance. It is the most immediate signal that something has gone wrong — or that the system is in control and results can be released.
📋 ISO 15189:2022 — Clause 7.3.3 : Laboratories shall have a procedure for monitoring the validity of results. Recorded data shall be evaluated and reviewed at defined intervals to detect trends that may indicate a problem with examination performance. Internal quality control tools are the primary mechanism for fulfilling this obligation.
Why Quality Control Matters ?

No airline would permit a flight without systematic pre-flight instrument checks. Laboratory medicine operates on the same principle. Clinicians rely on your results to make life-critical decisions — and they expect those results to be accurate, precise, and reliable every single day.
Table of Contents
What Are Internal Quality Control Tools?
Internal quality control tools are the analytical methods, statistical techniques, and graphical instruments that a laboratory uses — in-house, on its own schedule — to confirm that its measurement systems remain stable, accurate, and precise throughout every working period.
Internal quality control tools serve two primary functions:
- Daily monitoring—detecting random and systematic errors in real time, so that each run can be accepted or rejected with confidence.
- Monthly review — evaluating the overall performance of the analytical process across a reporting period, identifying trends, biases, and opportunities for improvement.
💡Key Point : IQC specifically monitors day-to-day analytical performance. It is the most immediate signal that something has gone wrong — or that the system is in control and results can be released.
Daily QC Interpretation Tools
Before patient results are reported, the laboratory must confirm that its analytical instruments are functioning within defined performance limits. The two foundational internal quality control tools for this purpose are the Levey-Jennings chart and Westgard Rules — which work in tandem to provide both a visual record and a statistical decision framework.
The Levey-Jennings Chart
The Levey-Jennings (L-J) chart is the most universally recognised internal quality control tool in laboratory medicine. It plots consecutive QC values on a time axis, with horizontal reference lines drawn at the mean and at ±1SD, ±2SD, and ±3SD.
Laboratorians interpret four distinct pattern types on the L-J chart:
- Shifts: A sudden jump of six or more consecutive QC values to one side of the mean, often indicating a calibration change, reagent lot switch, or instrument maintenance event.
- Trends: A gradual, directional drift of five or more values, suggesting slow reagent deterioration, temperature drift, or cumulative instrument fatigue.
Outliers: A single point far beyond ±3SD, typically reflecting a sporadic random error — a contaminated control vial, air bubble in a pipette, or momentary instrument malfunction.

💡Establishing Control Limits : Laboratories must established their own mean and SD from a minimum of 20 independent QC measurements performed under stable conditions. Manufacturer-assigned values are a starting point only; lab-verified limits are required by ISO 15189:2022.
Westgard Multi-Rule System
1981 – Introduction of Westgard Rules
- James O. Westgard and colleagues developed multi-rule quality control procedures.
- Combined several statistical rules to improve error detection while reducing false rejection.
Purpose of Westgard Rules
- Detect Random Errors and Systematic Errors.
- Improve analytical quality.
- Prevent release of incorrect patient results.
⚠️ Common Misconception : Laboratories that apply a simple ±2SD single-rule rejection strategy unnecessarily discard approximately 1 in 10 perfectly acceptable runs. The Westgard multi-rule approach resolves this by reserving rejection for statistically meaningful combinations of rule violations.

Review of IQC Using Westgard Rules


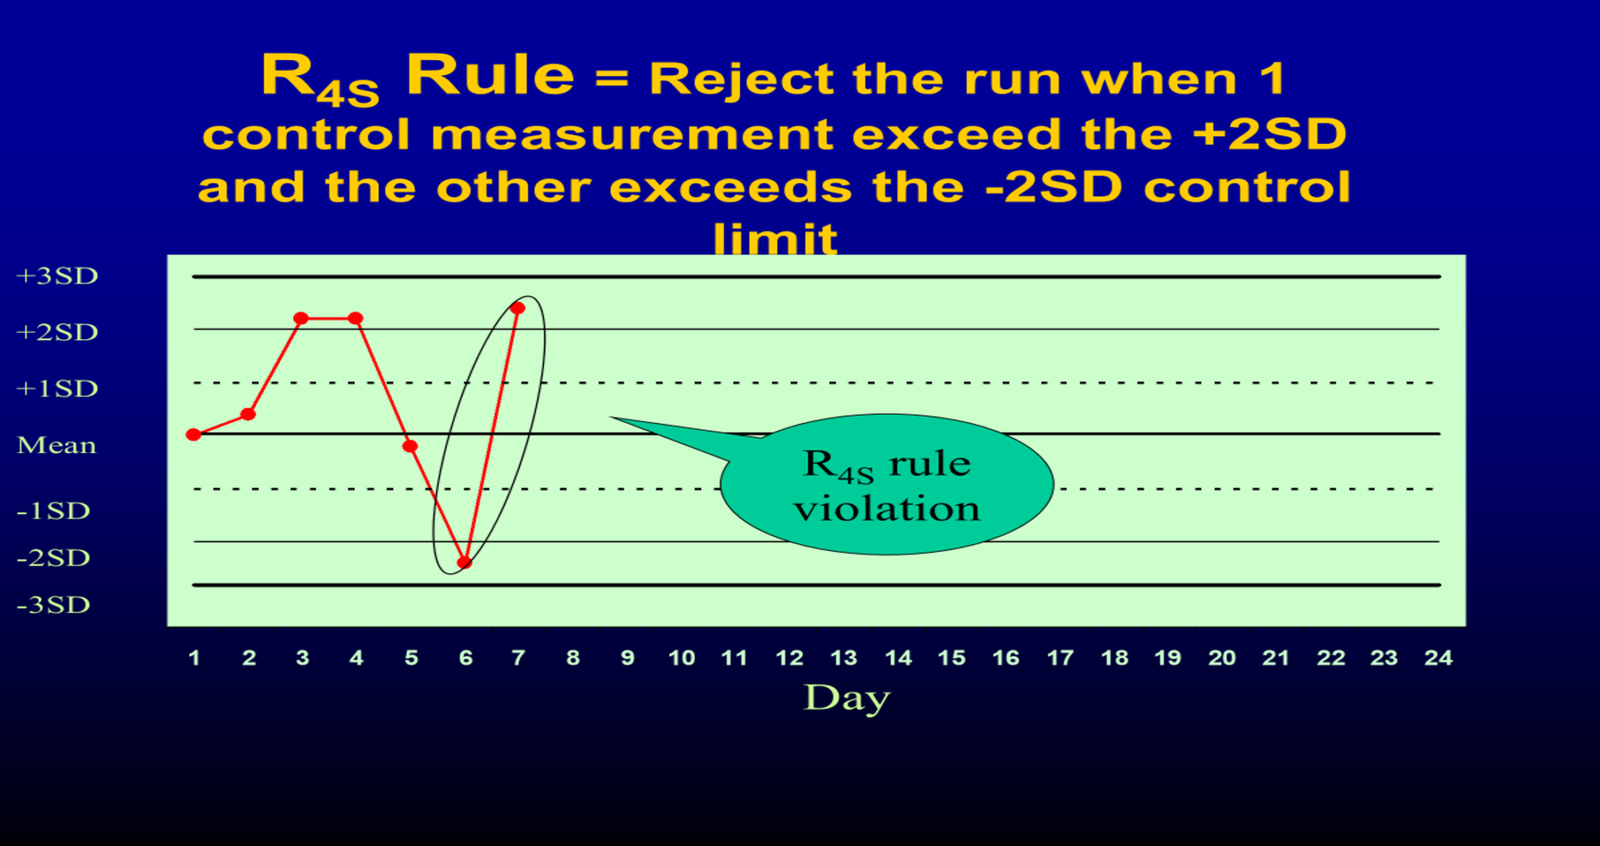


Westgard Rules – IQC Review
A trend in QC results is a gradual increase or decrease in control values over time, indicating a progressive change in the testing process. Ignoring trends can lead to inaccurate patient results and compromised laboratory quality.

Monthly QC Interpretation Tools
Monthly analysis transforms accumulated data into performance indicators that guide calibration schedules, reagent procurement decisions, QC rule selection, and accreditation documentation.
Coefficient of Variation (CV%)
The CV% is the universal measure of analytical imprecision — how reproducible the measurement process is, independent of the unit or concentration of the analyte.
CV% = (SD ÷ Mean) × 100
A low CV% signals a precise, stable system. Acceptable thresholds vary by analyte and clinical context: electrolytes typically require a CV% below 2%, while immunoassays may tolerate up to 8-10%. These targets are ideally derived from biological variation data — the Ricos database provides desirable imprecision goals based on within-subject biological variation for most common analytes.
Standard Deviation Index (SDI)
The SDI is a peer-comparison metric: it expresses how far a laboratory’s monthly QC mean deviates from the mean of other laboratories using the same method and instrument, in units of the peer group standard deviation.
SDI = (Lab Mean − Peer Mean) ÷ Peer SD
Interpretation:
- |SDI| ≤ 1.0 — Excellent; no significant bias relative to peer group
- |SDI| 1.0-2.0 — Acceptable; worth monitoring if consistent across months
- |SDI| > 2.0 — Significant bias; investigate calibration, reagent lot, or method drift
Bias%
Where SDI expresses bias relative to peers, Bias% expresses it in absolute terms — the percentage deviation of the laboratory mean from a reference or target value.
Bias% = [(Lab Mean − Target Mean) ÷ Target Mean] × 100
Bias% is particularly significant when evaluating performance against certified reference materials (CRMs), reference method values, or EQA assigned values. A persistently positive or negative Bias% signals a systematic accuracy problem that must be investigated regardless of whether day-to-day precision looks acceptable.
Six Sigma Metrics — Integrating Precision and Accuracy
Six Sigma metrics represent the most powerful single-number summary of analytical method performance available in laboratory quality management. Borrowed from industrial manufacturing, the Sigma score integrates both imprecision (CV%) and bias into one metric, calibrated against the Total Allowable Error (TEa) — the maximum error that is clinically acceptable for a given analyte.
Sigma = (TEa − |Bias%|) ÷ CV%

📐 Practical Example (Serum Glucose) : TEa = 10% (CLIA criteria) | Bias = 1.5% | CV = 1.8% Sigma = (10 − 1.5) ÷ 1.8 = 4.7σ → Acceptable performance. Standard Westgard multi-rule QC with two control levels is appropriate.
QC Software Platforms
Modern clinical laboratories rarely implement internal quality control tools using paper charts alone. Dedicated QC software platforms automate L-J charting, apply Westgard Rules in real time, compute monthly statistics, and generate peer comparison reports — replacing hours of manual calculation with instant, auditable records.
| Platform | Short Description | Link |
|---|---|---|
| Bio-Rad Unity Real Time | A comprehensive real-time QC data management solution offering Levey-Jennings charts, Westgard rule monitoring, peer group comparison, and Sigma metrics for clinical laboratories. (Bio-Rad) | Bio-Rad Unity Real Time |
| Westgard QC Tools | Industry-leading quality control resources featuring Six Sigma calculators, Westgard rule applications, QC planning tools, and laboratory quality management training. (Westgard QC) | Westgard QC Tools |
| LIS-Integrated QC Modules | Laboratory Information System (LIS) integrated QC solutions that automate rule checking, result flagging, and quality management workflows across multiple analyzers. | MEDITECH Laboratory Solutions |
| EasyQA / LabQA | Affordable QC management software offering Levey-Jennings charts, monthly QC summaries, multi-user access, and quality monitoring for small to medium-sized laboratories. | Labquality Solutions (EasyQC/EQA Services) |
Internal Quality Control Tools and ISO 15189:2022 Compliance
ISO 15189:2022 places internal quality control at the centre of examination quality assurance. The standard requires laboratories not only to use IQC, but to design their IQC procedures deliberately — selecting the right tools for the clinical risk profile of each analyte, reviewing performance at appropriate intervals, and documenting every corrective action.
Key requirements include:
- Using QC materials that, as far as possible, behave like authentic patient samples
- Establishing and documenting acceptance and rejection criteria for every examination procedure
- Monitoring and reviewing QC data at defined intervals appropriate to the measurement procedure’s stability
- Investigating all QC failures promptly and recording the root cause and corrective action taken
Retaining QC records as evidence of examination quality, available for accreditation assessment
✅ Accreditation Tip (AERSSC / NABL) : Assessment bodies expect documented evidence of both daily QC monitoring (L-J charts, rule violations, and corrective actions) and monthly QC review (CV%, SDI, Bias%, Sigma trends). A well-maintained QC register with graphical records and signed corrective action logs is essential for successful assessment visits.
Conclusion
Internal quality control tools are not a regulatory formality — they are the analytical immune system of the clinical laboratory.
- The Levey-Jennings chart makes error visible. Westgard Rules make it actionable. CV% and SDI quantify performance drift month by month.
- Six Sigma frames the entire operation within a clinically meaningful performance standard.
- A laboratory that integrates all of these tools — implementing daily multi-rule QC, conducting systematic monthly statistical reviews, and benchmarking against peer SDI — builds a culture of continuous quality improvement that directly protects patient safety and satisfies the full expectations of ISO 15189:2022 and national accreditation bodies.
- The investment in understanding and rigorously applying internal quality control tools is, ultimately, an investment in the reliability of every result that carries a patient’s name.
Master laboratory quality assurance with our comprehensive resources. Learn about essential Internal Quality Control Tools and understand the complete Quality Control process in Clinical Laboratories to improve accuracy, consistency, and compliance.
🔗 Internal Quality Control Tools: https://labtestacademy.com/internal-quality-control-tools-in-clinical-laboratory/
🔗 Quality Control in Laboratory: https://labtestacademy.com/quality-control-in-laboratory/